
The world of online advertising is a world of randomness and probabilities. Readers click on items in specific contexts with a certain probability, they bounce from reading an article after a certain time with a certain probability and so on.
In this sense, there are definitely some similarities between our work at Content Garden and gambling in a casino: In roulette you may bet on ‘red’ or ‘black’, whereas for online advertising, you might choose variant A or B of your content. The exact performance of a teaser, an article, or a campaign is not known beforehand – but data can be collected, and mathematical models can be used to make predictions, quantify our uncertainty, and use our knowledge to maximize performance.
The Exploration-Exploitation Dilemma
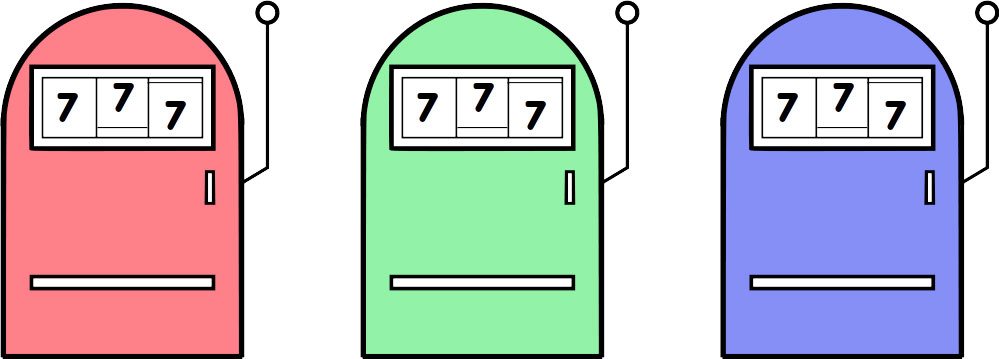
Figure 1: One-armed bandit slot machines. Each machine has a different payout rate.
Imagine you got a voucher from a casino to play the one-armed bandit slot machines 1000 times for free. The casino has three different machines as illustrated in Figure 1. If you pull the arm of one of the slot machines, with probability p you win 1€, otherwise you get nothing. The casino tells you that the payout probabilities pred,pgreen,pblue are different for the different machines, but neither it tells you the exact values nor if any machine is working better than any other one. Your task is therefore to explore, i. e., to try out the different machines to gain knowledge about their performance, but at the same time you want to exploit what you already know and play the machine you think performs best as often as possible to maximize your profit. This is the classic form of a Multi-Armed Bandit problem (that’s the official name mathematicians use to refer to this problem) exemplifying what is called the Exploration-Exploitation Dilemma.
The problem of finding the optimal strategy to play the various slot machines is so straightforward to understand but so hard to solve that Allied scientists suggested dropping it over Germany during World War II in order to distract German scientists from their military work with ”Discussion of Dr Gittins’ paper.” The actual, optimal solution (via Gittins indices) is complex and shows exponential scaling with respect to the number of pulls, which makes it inapplicable in most scenarios. However, there are well-established heuristic strategies with much better scaling behavior, (almost) equivalent performance and manageable implementation effort.
The connection to playing out advertising content in the best possible way suggests itself immediately: The slot machines correspond to different content and their payout rate is equivalent to the considered (unknown) KPI, e. g., the click-through rate.
A traditional approach in online advertising: A/B testing
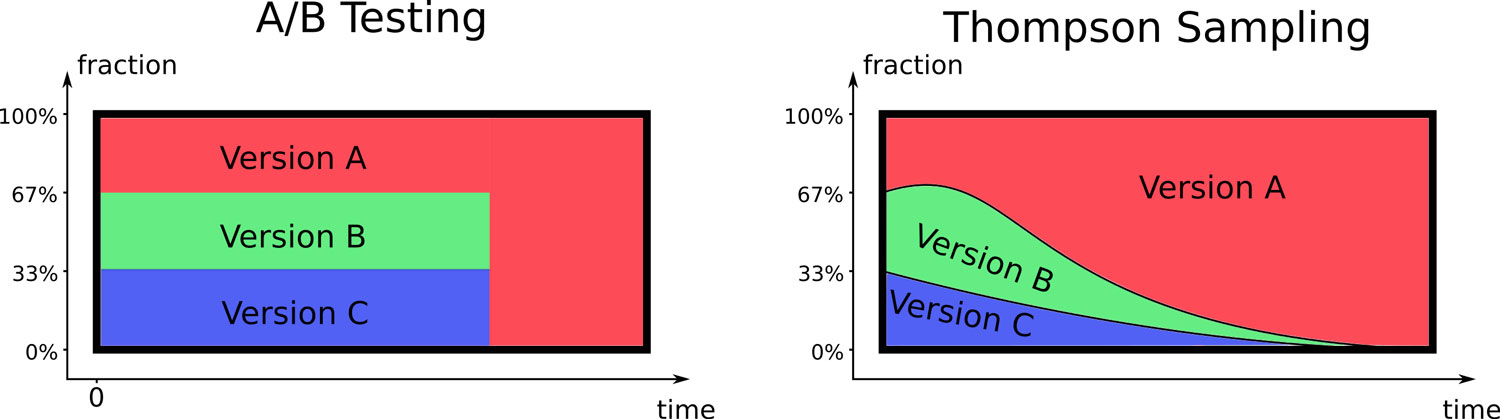
Figure 2: A/B Testing vs. Thompson Sampling. In A/B testing, all variants are tried out until the best one with a predefined level of significance is found. Then, everything is turned off except for the supposedly best variant. In contrast, Thompson Sampling starts optimizing right from the beginning and no variant is ever turned off completely.
Viewing the problem through the eyes of a marketer, you may think that the problem is a textbook example for A/B testing. You are absolutely right! You could start by trying the red, green, and blue machines equally until you reach a specific level of significance for your hypothesis that, e. g., the red machine is the best option. Then, you would turn off the green and blue machines and only continue with the red one until you run out of pulls as shown in the left part of Figure 2. However, classical A/B testing hast a few weaknesses, which I’d like to briefly summarize below:
- The number of runs, i.e., the number of lever pulls or ad impressions for your content may be too low to reach a reliable level of significance for the decision to turn off one or multiple tested versions completely. You may not reach the 95% level of significance in your free 1000 runs on the slot machines, leaving the casino with 333 pulls on each machine.
- The level of significance needs to be specified manually. Is the common value of 95% optimal or should you rather use 90 or 99%?
- Runs/impressions are wasted unoptimized in the beginning, as every variant is played with equal fraction.
- You ultimately decide on a version when you have reached your level of significance. If you have chosen 95%, there is still a probability of 5% (1 out of 20!) that you are only observing your hypothesis by chance and that a different version would actually have performed better – but you have decided to turn it off forever.
- What if you have some knowledge a priori? For example, before you start playing the slot machines, your friend may call you, telling you that last week, she observed that the green machine performed best for her. Similarly, you may want to optimize three different teasers, one of which is very similar to a teaser you used in another campaign over a year ago. In classic A/B testing, it is hardly possible to make use of this a priori knowledge.
State of the art algorithm: Thompson Sampling
Actually, there is an algorithm that can unwind all of the shortcomings mentioned above. It is called Thompson Sampling, named after William R. Thompson, who first described it in his famous 1933 paper “On the likelihood that one unknown probability exceeds another in view of the evidence of two samples”.
The basic concept of the algorithm is probability matching: Imagine we collected our first batch of data, i. e., some successes & failures of a handful of trials on the three slot machines. If mathematics tells us that, based on the observed data, the probability of being the best machine is 50% for the red, 30% for the green and 20% for the blue one, the Thompson Sampling strategy is to play the red machine with exactly 50%, the green one with 30% and the blue one with 20% probability in the next run. It thus matches the probabilities of being the optimal variant (= the best machine or content) with the fraction of times this variant should be played – thereby automatically balancing exploration and exploitation in a very stable and performant manner.
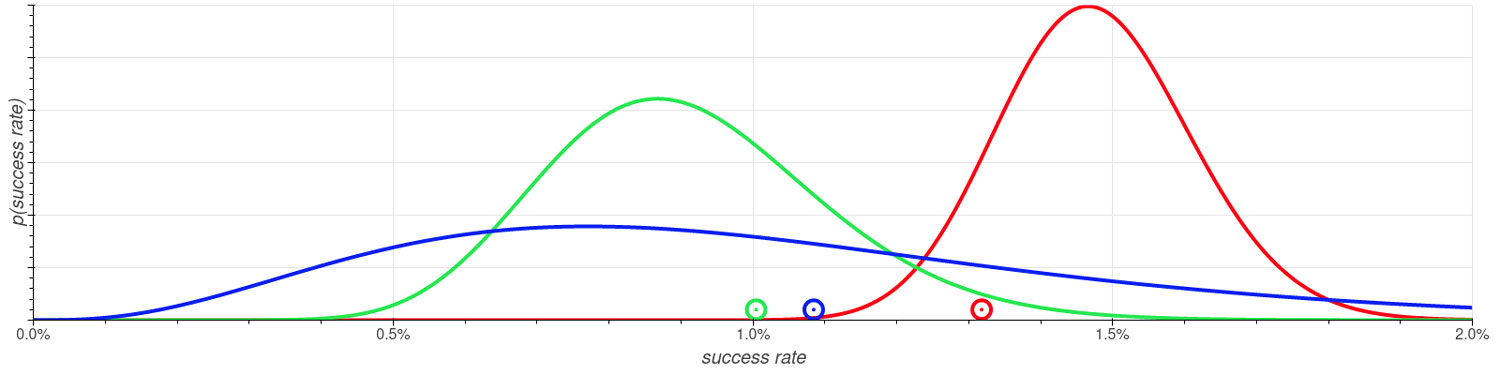
Figure 3: Probability distributions over the success rates of the different slot machines. The success rates could be click rates of different variants of ad content. The dots along the x-axis are random samples drawn according to the respective distributions. Thompson Sampling draws such random numbers in every round and plays the variant with highest random number. The event (success/no success) is observed and the probability distribution is updated accordingly before the same procedure is repeated in the next run.
The crucial step, obviously, is to establish the correct probability distributions over the success rates of the different machines. This can be achieved using Bayes’ Theorem – a concept that is definitely worth another blog article. The resulting distributions may look like the curves depicted in Figure 3. The more runs have been carried out with a slot machine, the more we know about its success rate – the sharper the respective probability distribution will be. In Figure 3 it looks like the red machine is most likely to perform the best. However, it still seems possible that the blue one actually performs better. We can’t be entirely sure because we haven’t collected a lot of data for it yet. The most reasonable strategy is thus to play the red machine most of the time, but also sacrifice some pulls on the blue and even the green machine to gain further knowledge.
From the point on where these probability distributions are established, the Thompson Sampling algorithm is pretty simple: In each run, draw random numbers from the established probability distributions (visualized by the dots along the x-axis in Figure 3), and play the machine that belongs to the largest random number. Then, update the probability distribution with the data observed (success or failure) and repeat the process. Over time, the runs will be distributed among the different machines as visualized on the right part of Figure 2.
It is even possible to use a priori knowledge by starting from probability distributions that are centered around what is believed to be the success rate before any data have been observed! So it can be combined with any kind of machine learning model that is able to predict the success rate out of previously seen data from similar slot machines/ad content.
Sounds nice, but what’s the benefit of all this?
At Content Garden, the Thompson Sampling strategy is used to test and optimize teasers against each other with respect to their click-through rates. The algorithm is so stable and reliable that no manual control is necessary from day 1. All the shortcomings of classical A/B testing are overcome, and even small campaigns can be optimized to a certain extent, although obviously optimization is more effective for larger campaigns.
Moreover, it enables us to produce more ‘explorative’ content, i. e., to try out new approaches to different topics without running the risk of messing up a campaign because Thompson Sampling will sort out underperforming content quickly. In combination with a click-through rate prediction model, it is even possible to include data from identical teaser image & text data that ran before on different placements or in different campaigns to the optimization process. Depending on the campaign, a 20-30% increase in click-through rates is possible compared to manual optimization strategies.
And that has nothing to do with luck, but with pure mathematics – applied to successful native advertising.